
Quick Summary
- Last mile delivery now accounts for 53% of total shipping costs
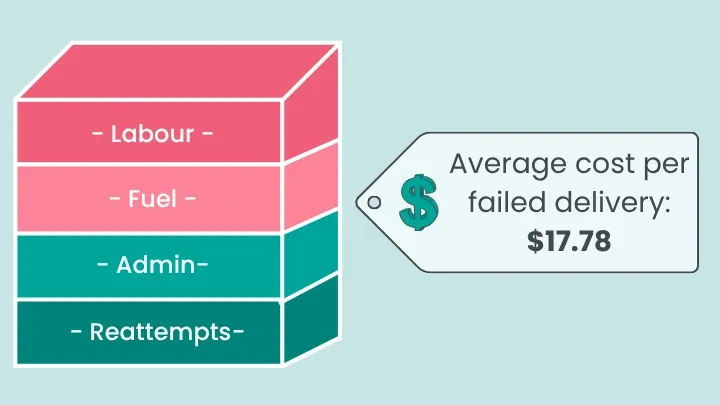
- Cost per failed delivery on average reaches just under $18
- 91% of consumers will actively track packages
- 70% of shoppers value sustainable delivery options
- Over 90% of customers will abandon shopping carts due to delivery fees
The economics of last-mile delivery have changed dramatically.
Costs that once accounted for 41% of total shipping in 2018 now represent 53% in 2024, making the last mile the most expensive and operationally complex part of the last mile logistics chain.
This shift reflects a convergence of factors: rising consumer expectations, labour shortages, regulatory and environmental requirements, and the introduction of new technologies, including autonomous vehicles, artificial intelligence, and alternative delivery networks.
This collection of statistics highlights the current state of last mile delivery, illustrating the financial pressures, operational challenges, and evolving consumer expectations that define the industry in 2025.
Cost Economics: The Escalating Financial Burden
Per-delivery economics reveal substantial differences depending on geography and service type.
Urban deliveries typically cost around $10 per package, while rural deliveries can reach $50 due to lower population density and longer travel distances.
Specialty services, such as grocery delivery, often cost $10-20 per package because of temperature control, fragility, and strict time requirements.
Despite these costs, consumers are generally charged only $8.08 on average, meaning businesses absorb a significant portion of expenses directly from profit margins.
Labour dominates the cost structure.
Drivers account for 50-60% of total last-mile expenses, with express delivery commanding higher wages.
For example, U.S. express delivery drivers earn an average $25.10 per hour compared with standard delivery rates, reflecting the premium paid for speed and reliability.
Fuel, vehicle maintenance, and technology further increase costs.
Fuel accounts for roughly 10-25% of expenses, with vehicles averaging just 6.5 miles per gallon and consuming almost a gallon per hour while idling.
Maintenance adds around 20% of total costs, while route optimization software and delivery platforms account for 10-15%. Investments in technology are essential, as even small efficiency gains can reduce both mileage and operational expenses.
Consumer Expectations: Speed and Transparency Now Non-Negotiable
Consumer expectations have shifted dramatically, redefining what it means to provide a competitive delivery experience.
According to 2024 surveys, 77% of online shoppers expect delivery within two hours for certain products. More broadly, 80% of consumers now consider same-day delivery a standard expectation.
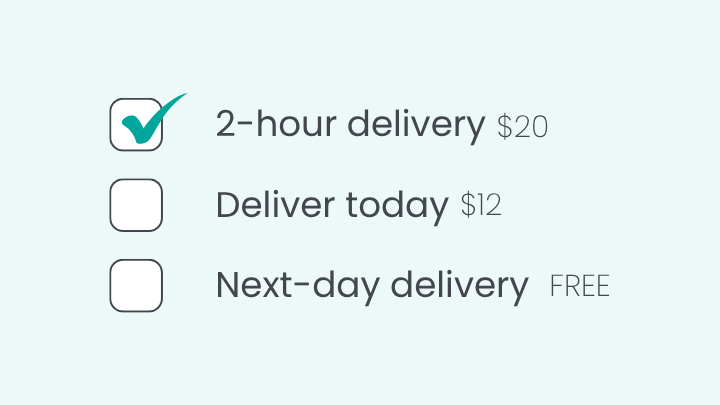
Even when speed is available, cost remains critical with 92% of shoppers reporting that free shipping influences their purchase decisions, and over 90% abandon carts when shipping costs are too high.
Free shipping dominates the purchase decision calculus. An overwhelming 92% of consumers report that free shipping offers directly impact their purchase decisions, up from 83% just one year prior.
More than 90% will abandon shopping carts when confronted with high shipping costs, and 66% expect free shipping on all online purchases without exception.
When given a choice, over 95% prefer free shipping with standard delivery versus paid shipping with expedited delivery, revealing that most consumers prioritize cost over speed when forced to choose.
Tracking and visibility are no longer optional.
Approximately 91% of consumers actively track their packages, with nearly 20% checking multiple times daily.
These expectations extend beyond simple order status; customers now expect at least four notifications per order covering:
- Fulfillment
- Shipment
- Transit
- and Delivery
Transparency has become a baseline requirement, influencing satisfaction and loyalty as strongly as delivery speed.
Retailers are pressured to deliver quickly while maintaining accuracy, providing real-time updates, and controlling costs. Companies that fail to meet these expectations risk not only losing sales but also long-term damage to customer trust.
Failed Deliveries: The Hidden Crisis Destroying Profitability
First-attempt delivery failure rates remain significant, ranging from 8% to 20% depending on geography, carrier, and delivery type.
In some segments, more than one in ten deliveries fail on the first attempt, highlighting persistent operational challenges across the industry.
Address errors are a primary contributor, accounting for 45% of failed deliveries.
Missing or incorrect contact details, unclear instructions, and incomplete addresses create delays or outright failures.
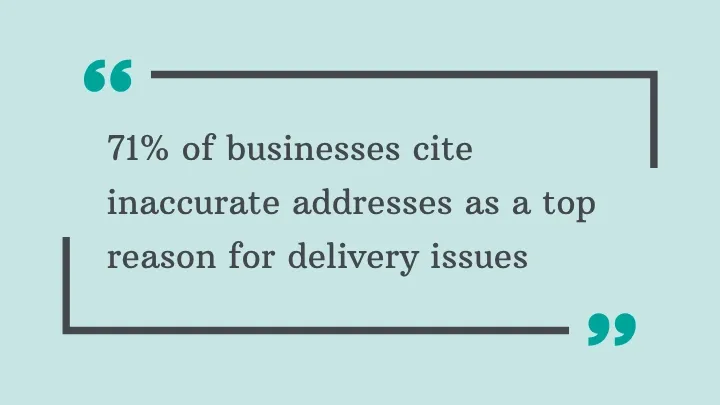
In retail specifically, 71% of businesses cite inaccurate addresses as a top reason for delivery issues. These errors not only delay packages but also increase operational costs and strain customer service resources.
Remarkably, one-third of companies either don't verify address data at all or leave verification up to the courier, a delegation of responsibility that directly contributes to failures.
Each failed delivery carries a measurable cost.
Direct expenses, including labour for re-attempts, customer service handling, and logistical disruption, add up to an average $17.78 per failed package (even a 5% failure rate can lead to losses of nearly $200,000 annually for a company handling 140,000 orders!).
Across the U.S., delivery failures contribute to an estimated $216 billion in lost retail revenue each year, demonstrating that operational inefficiencies have both immediate and systemic economic impacts.
The impact extends beyond financial loss. Customer loyalty suffers when deliveries fail.
Roughly 23% of consumers refuse to reorder after a failed delivery, while 21% lose trust in the retailer. These failures can permanently damage relationships that were expensive to establish, emphasizing that operational efficiency is directly tied to long-term revenue.
Proactive solutions mitigate these challenges. Address verification systems, regular notifications, and alternative delivery options all reduce the risk of failure.
For example, SMS alerts achieve nearly universal engagement, with open rates approaching 99% and delivery rates around 98%, ensuring customers can provide guidance or be home for the delivery.
When combined with robust verification and tracking systems, these measures significantly decrease missed deliveries and protect both customer satisfaction and profitability.
Environmental Impact: The Urgent Push Toward Sustainability
Last-mile delivery generates a disproportionate share of logistics emissions relative to its geographic scope.
Emissions per parcel vary significantly depending on delivery methods, fleet composition, and regional infrastructure. For instance, the Netherlands achieved 100 grams of CO2 per parcel in 2024, a 56% reduction from 230 grams in 2018, demonstrating the potential impact of fleet electrification and route optimization.
Globally, the weighted average stands at 204 grams CO2 per parcel.
Certain sectors, such as fashion delivery in the UK, can generate 264 grams of CO2 per parcel, reflecting differences in route density and vehicle types.
Without intervention, eCommerce parcel delivery could reach 5.5 million metric tonnes of CO2 by 2032, although electrification and alternative delivery methods could reduce emissions by over 90% in the next decade.
Alternative delivery models offer notable environmental benefits. Parcel lockers and pickup points in urban areas can cut CO2 emissions by up to two-thirds.
Microhubs with zero-emission vehicles for final delivery achieve reductions of up to 93%. Consolidated deliveries using optimized networks can cut trips by 30%, lowering both costs and emissions.
Consumer demand for sustainability is growing and influencing purchase behavior.
Around 70% of shoppers value eco-friendly delivery, and 66% consider it when making purchases.
Notably, 25% of consumers would switch retailers if green delivery options were unavailable, and 27% would pay extra for sustainable shipping.
Globally, 23% are willing to pay a premium, creating a strong incentive for carriers and retailers to invest in greener logistics infrastructure.
Market Size and Growth: Sustained Expansion Through 2035
The global last-mile delivery market is expanding rapidly.
In 2024, its size is estimated between $160 and $180 billion, with projections rising to $260-480 billion by 2030-2034.
Same-day delivery is a particularly dynamic segment. In 2024, the U.S. same-day market reached $9.25 billion and is projected to expand to $13.15 billion by 2030. This niche growth underscores shifting consumer expectations for speed and reliability in delivery services.
Europe accounts for roughly 24-30% of global market share, with slower growth rates reflecting market maturity and saturation. The region is projected at $49.8 billion in 2024, growing at approximately 2.5% CAGR through 2031.
Segment analysis shows that B2C deliveries dominate, contributing more than 70% of global revenue. eCommerce drives this segment, while the C2C segment is expanding fastest at an 11.4% CAGR, propelled by peer-to-peer marketplace expansion and platforms like eBay, Facebook Marketplace, Poshmark, and Vinted that enable consumers to sell directly to other consumers.
The combination of sustained global growth, niche expansion in same-day delivery, and increasing e-commerce penetration positions the last-mile market as a critical focus for logistics, technology, and retail strategies over the next decade.
Technology Adoption: Automation and Intelligence Transform Operations
Autonomous delivery solutions, including drones and robots, are moving from pilot programs to commercial deployments.
The global drone delivery market reached $693.3 million in 2024 and is projected to grow to $4.67 billion by 2030, reflecting a compound annual growth rate of 37.4%.
Consumer acceptance is high for these new delivery methods. Over 61% of consumers are willing to pay a premium for deliveries made by autonomous robots, viewing them as reliable and efficient (ResearchGate).
Same-day delivery remains a priority, with 51% of retail shoppers preferring it over longer shipping options, further driving demand for automation that can operate continuously without labour constraints.
Route optimization software is another area of rapid growth. The global market for these tools reached $7.93 billion in 2024 and is expected to hit $25.75 billion by 2033.
AI-driven optimization is delivering measurable results: DHL’s Greenplan dynamic routing algorithm achieved a 20% reduction in delivery costs, while Tesco’s AI-powered routing system saved 11.2 million miles and cut fuel consumption by 8% per order.
SmartRoutes Route Planning Software
Streamline your entire delivery process, all from one platform

Despite these advances, AI adoption across logistics companies remains early stage at around 12%, but early adopters report significant benefits, including up to 15% reduction in logistics costs and threefold higher ROI compared to traditional optimization approaches.
Real-time tracking has become baseline infrastructure rather than a differentiator.
With 91% of consumers actively monitoring packages (39% at least once per day and 19% tracking multiple times daily), companies face increasing pressure to maintain transparency.
Implementation of robust tracking systems reduces customer inquiries by up to 10% and claims related to misdelivery by 25%, demonstrating both operational and customer satisfaction benefits.
State of Last-Mile Delivery: Challenges and Opportunities
In summary, last-mile delivery is facing rising costs, higher consumer expectations, and operational complexity. Delivery now accounts for the largest portion of shipping expenses, and even small inefficiencies can have substantial financial and operational impacts.
Failed deliveries not only generate significant costs but also reduce customer trust and loyalty.
Consumers expect faster, more transparent service, with real-time tracking and multiple notifications becoming standard. Free or low-cost delivery continues to influence purchase decisions, making operational accuracy critical.
Technological solutions are helping businesses meet these demands.
Autonomous delivery, AI-driven route optimization, and smart locker networks are improving efficiency and scalability, while electrification and alternative delivery methods offer pathways to reduce emissions and costs.
Businesses that apply these insights can strengthen last mile delivery performance, control costs, and enhance customer satisfaction!
Use these statistics to benchmark your last-mile strategy and guide decision-making in logistics and eCommerce.
If you enjoyed this blog, you might also be interested in:
 Caroline Hassett