

Quick Summary
- Consumers report that digital retailers meet delivery speed expectations only 45% of the time.
- Customers value flexibility: 68% want shorter delivery windows, 36% want next-day, 30% prefer same-day, 19% want self-selected windows, and 20% choose a preferred carrier.
- Same-day delivery is offered by just over 50% of retailers, despite high demand.
- 22% of shoppers abandon carts because shipping is too slow.
- 46% of consumers consider reliability a top factor when choosing where to shop.
- First-attempt delivery success rates: UK 93.7%, US 97.2%, Ireland 88.07%.
- Failed deliveries cost $17.2 per parcel in the US or £11.6 in the UK, with 70% of shoppers unlikely to return after a failure.
- Out-of-home delivery is growing: nearly 35% of Europeans and 25% globally use lockers or pickup points, with projections for 80% of European parcels to be OOH by 2030.
Delivery success rates offer a window into the performance of modern retail and eCommerce operations.
By looking at first-attempt success, delivery accuracy, and on-time delivery metrics, we can see where the system excels, where it struggles, and how trends are shaping the future of delivery across the globe.
Understanding Delivery Success Across Regions
Table 1: First Attempt Delivery Rates (FADR)
Delivery success varies significantly depending on country and sector.
For example, the United States reports a first-attempt success rate of 97.2%, which is higher than the UK’s 93.7% and Ireland’s 88.07%.
These differences highlight variations in infrastructure, logistics efficiency, and operational practices across regions.
Maintaining a high first-attempt delivery rate is crucial because it directly impacts costs and customer experiences.

Failed deliveries often require multiple attempts, increasing operational expenses and tying up driver resources.
Companies that achieve On-Time Delivery (OTD) rates of 95% or higher are considered to be performing at an exemplary level. Achieving this can make the difference between a retailer that retains loyal customers and one that risks losing them to competitors.
Despite these impressive figures in certain markets, delivery challenges remain a major concern. Globally, 67% of customers report experiencing delivery issues. Problems such as incorrect addresses, missed delivery windows, or delayed shipments contribute to these failures.
First-Attempt Delivery Performance
Table 2: Causes of First-Attempt Failures
Failed first deliveries are expensive and disruptive. Globally, 8–20% of parcels fail to reach the recipient on the first attempt, and this can significantly escalate costs.
DPD typically makes two attempts per parcel if the first delivery fails, which essentially doubles the cost per delivery. Considering customers only pay for one attempt, or avail themselves of free shipping, businesses then have to absorb this cost.
Several recurring issues affect the first attempt delivery rate (FADR):
- Customer not available: Around 36% of failed first attempts occur because recipients are not home. This is especially prevalent for parcels requiring a signature or larger, bulky items.
- Incorrect or incomplete addresses: Approximately 22% of failures result from inaccurate address information. Address validation tools and customer communication can mitigate this issue.
- Timing challenges: 67% of customers report problems aligning delivery windows with their availability, highlighting the importance of flexible delivery options.
On-Time Delivery Performance
Table 3: On-Time Delivery Metrics
Speedy delivery is often sought after by consumers, however, only about 45% of digital retailers actually meet their delivery speed expectations. This gap creates frustration among shoppers, with over 22% abandoning carts because shipping is too slow.
Same-day delivery is a particularly high-demand service, yet just 50% of retailers offer it. The challenge is balancing operational feasibility with consumer expectations.
Deliveries that arrive on time directly impact customer loyalty and revenue:
- On-time deliveries can increase customer loyalty by up to 25%.
- Conversely, 60% of consumers will not shop again after experiencing a late delivery.
- Great delivery experiences can create positive word of mouth, with 94% of satisfied customers recommending the retailer to peers.
(Source: Opensend).
These stats illustrate that even a few delayed deliveries can have huge effects on revenue and brand perception.
Maintaining high On-Time Delivery (OTD) rates is critical. An OTD rate below 90% can significantly harm repeat purchase rates and overall satisfaction. Common challenges include urban traffic, weather, and operational bottlenecks, all of which can erode delivery performance.
SmartRoutes Route Planning Software
Streamline your entire delivery process, all from one platform

Retailers that focus on improving OTD not only protect customer loyalty but also enhance operational efficiency and cost management. Clear communication, real-time tracking, and efficient routing are key strategies to maintain exemplary performance.
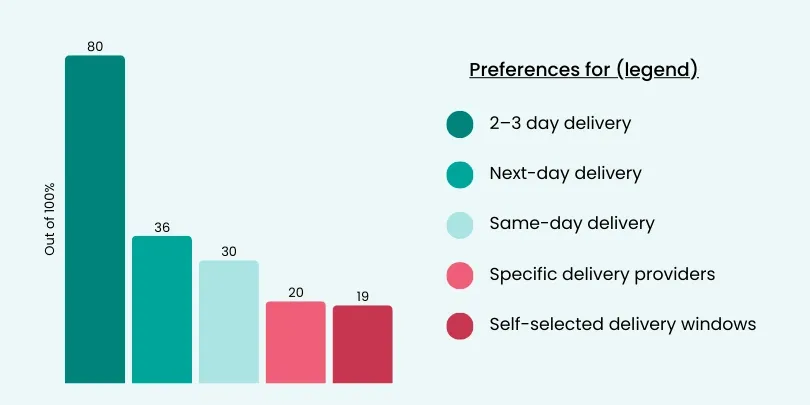
Customer Delivery Preferences
Table 4: Delivery Preference Statistics
Consumers continue to look for delivery choices that fit around their lives rather than the retailer’s schedule. A large share of shoppers now want the ability to pick narrower time windows, with 68% saying shorter delivery windows are important.
Beyond timing, convenience plays a major role. Options like choosing a preferred carrier or selecting a delivery slot are no longer seen as premium extras but expected parts of the checkout experience.
This shift towards flexibility reflects a broader trend where convenience and reliability matter as much as speed.
This shows that the majority of shoppers aren’t demanding instant fulfilment. Instead, they want predictable delivery with clear communication. Retailers that prioritise reliability and transparency often outperform those that chase speed without the operational strength to support it.
Why Reliability Matters More Than Speed
Reliability remains one of the strongest drivers of purchasing decisions. In fact, 46% of consumers say reliability is one of the top attributes they look for in a retailer.
Good delivery performance also ties directly to loyalty. When retailers deliver on time, 75% of customers return, but 60% say they won’t shop again after a late delivery.
Delivery Accuracy and Operational Metrics
Table 5: Accuracy and Fulfillment Metrics
Accuracy continues to be one of the most influential drivers of delivery performance, customer satisfaction, and overall logistics cost. Even small improvements in fulfillment precision can reduce waste across the entire supply chain.
Retailers already achieving strong results report delivery accuracy rates of 92%, a benchmark that reflects how well-coordinated warehouse processes and last mile operations must be to avoid costly mistakes. This is closely tied to On-Time In-Full expectations, where a 95% OTIF score is considered an excellent standard for consistent and reliable delivery execution.
Inside the warehouse, picking accuracy remains a defining factor. Top performers reach 99.9% accuracy. However, industry-wide performance varies. Around 35% of warehouses experience a picking error rate of 1% or more, which may seem small but can quickly escalate when operating at volume. These errors carry financial consequences, with data showing that a single picking mistake can lead to profit losses of up to 13% once returns, repacking, customer service time, and replacement shipments are accounted for.
Out-of-Home Delivery and Parcel Lockers
Table 6: OOH Delivery Trends
Out-of-home delivery continues to gain traction as retailers and carriers look for more reliable alternatives to traditional doorstep delivery. Current data shows that 35% of Europeans already use OOH options, with 25% of global consumers doing the same. This reflects a shift toward convenience, predictability, and reduced delivery friction.
By 2030, analysts expect 80% of parcels in Europe to be delivered to out-of-home points, a dramatic rise driven by network expansion, retailer incentives, and increasing consumer familiarity with locker and pick-up point systems.
In the UK, adoption is steady but still developing. Only 7% of parcels are delivered via lockers today, although the model is proving valuable for handling returns, where 12% of online shoppers choose lockers due to convenience and speed. This suggests OOH returns may scale faster than OOH outbound delivery.
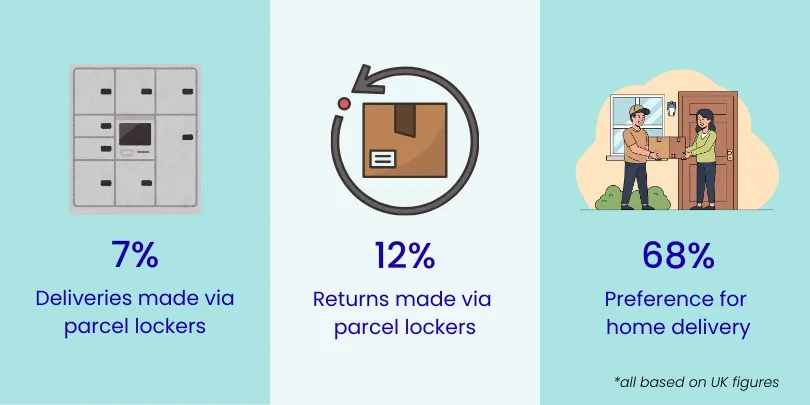
One of the strongest cases for OOH delivery is its ability to reduce failed attempts. In dense urban areas, where accessibility, security, and predictable timing are ongoing challenges, 25% of home deliveries fail on the first attempt. Locker networks and staffed pick-up points help eliminate these issues by giving customers more control over when and how they collect parcels.
Collectively, these trends show a clear direction: while home delivery remains preferred by the majority, out-of-home solutions are becoming a crucial part of delivery strategy. They help reduce operational waste, cut redelivery costs, and provide consumers with more dependable options in busy or hard-to-serve locations.
What These Delivery Statistics Mean for Retailers Today
The data makes one thing clear: delivery performance now shapes the entire customer experience. Speed, accuracy, and flexibility all influence whether shoppers complete a purchase, return to a retailer, or recommend a brand to others.
When deliveries arrive on time, in full, and without friction, customer confidence rises. When they don’t, the impact is immediate, from higher costs to reduced loyalty.
Across markets, first-attempt delivery success rates vary widely, and so do consumer expectations. A reliable delivery promise has become a key competitive differentiator. The same applies to operational accuracy: even a small picking error or an incomplete address can trigger delays, added costs, and a lost repeat customer.
Out-of-home delivery, shorter delivery windows, same-day expectations, and the steady rise of parcel lockers all show how quickly the landscape is shifting. Retailers who invest in both speed and reliability are better positioned to meet the expectations highlighted throughout this report.
If improving your delivery success rates, reducing failed attempts, or strengthening customer satisfaction is a priority, we can help. Get in touch to learn how to build a more reliable and cost-efficient delivery operation.
FAQ
1. How often do eCommerce deliveries fail on the first attempt?
Globally, 8–20% of parcels fail to reach the recipient on the first attempt. Common reasons include customers not being home (36%), incorrect addresses (22%), or timing issues such as signature requirements (67%).
2. What is the average cost of a failed delivery?
Failed deliveries cost approximately $17.2 per parcel in the United States and £11.6 per parcel in the United Kingdom, with 70% of shoppers unlikely to return after experiencing a failed delivery.
3. Which delivery methods do consumers prefer most?
- 2–3 day delivery: 80 percent
- Next-day delivery: 36 percent
- Same-day delivery: 30 percent
- Shorter delivery windows: 68 percent
4. How prevalent is out-of-home delivery?
- 35 percent of Europeans and 25 percent globally have parcels delivered to OOH locations
- In the UK, 7 percent of parcels are delivered via lockers
- 12 percent of online returns in the UK are processed through lockers
If you enjoyed this blog, you might also be interested in:
 Caroline Hassett